
As I write this, we are 605 blocks away from the next Bitcoin Halving. This epoch has been tumultuous, marked by the COVID-19 pandemic, economic stimulus checks, mandatory vaccinations, the Russia-Ukraine conflict, a shift in Chinese mining operations, and a record-setting Bitcoin price. Through it all, Bitcoin has continued to operate as designed.
In my previous writings on mining during this epoch, I discussed the dramatic increase in hash rate over the last 210,000 blocks. However, I had not delved into the specifics of which entities actually mined these blocks, though I have explained how block construction works.
My insight into which mining pools were dominant came from using mempool.space and a NSFW Telegram bot created by my friend, likewh0a. This sparked my curiosity about the landscape of mining pools and led me to investigate who really dominated this epoch.
To do this, I needed a comprehensive dataset listing every block mined and the respective miners. Although this data is accessible via my node, I lack the technical skills to extract it myself, so I enlisted likewh0a’s help. He developed a bot to compile this information into a CSV file, which I then cleaned and used to create a chart in Excel.
Stacked Area Chart of Bitcoin Mined by Pool This Epoch
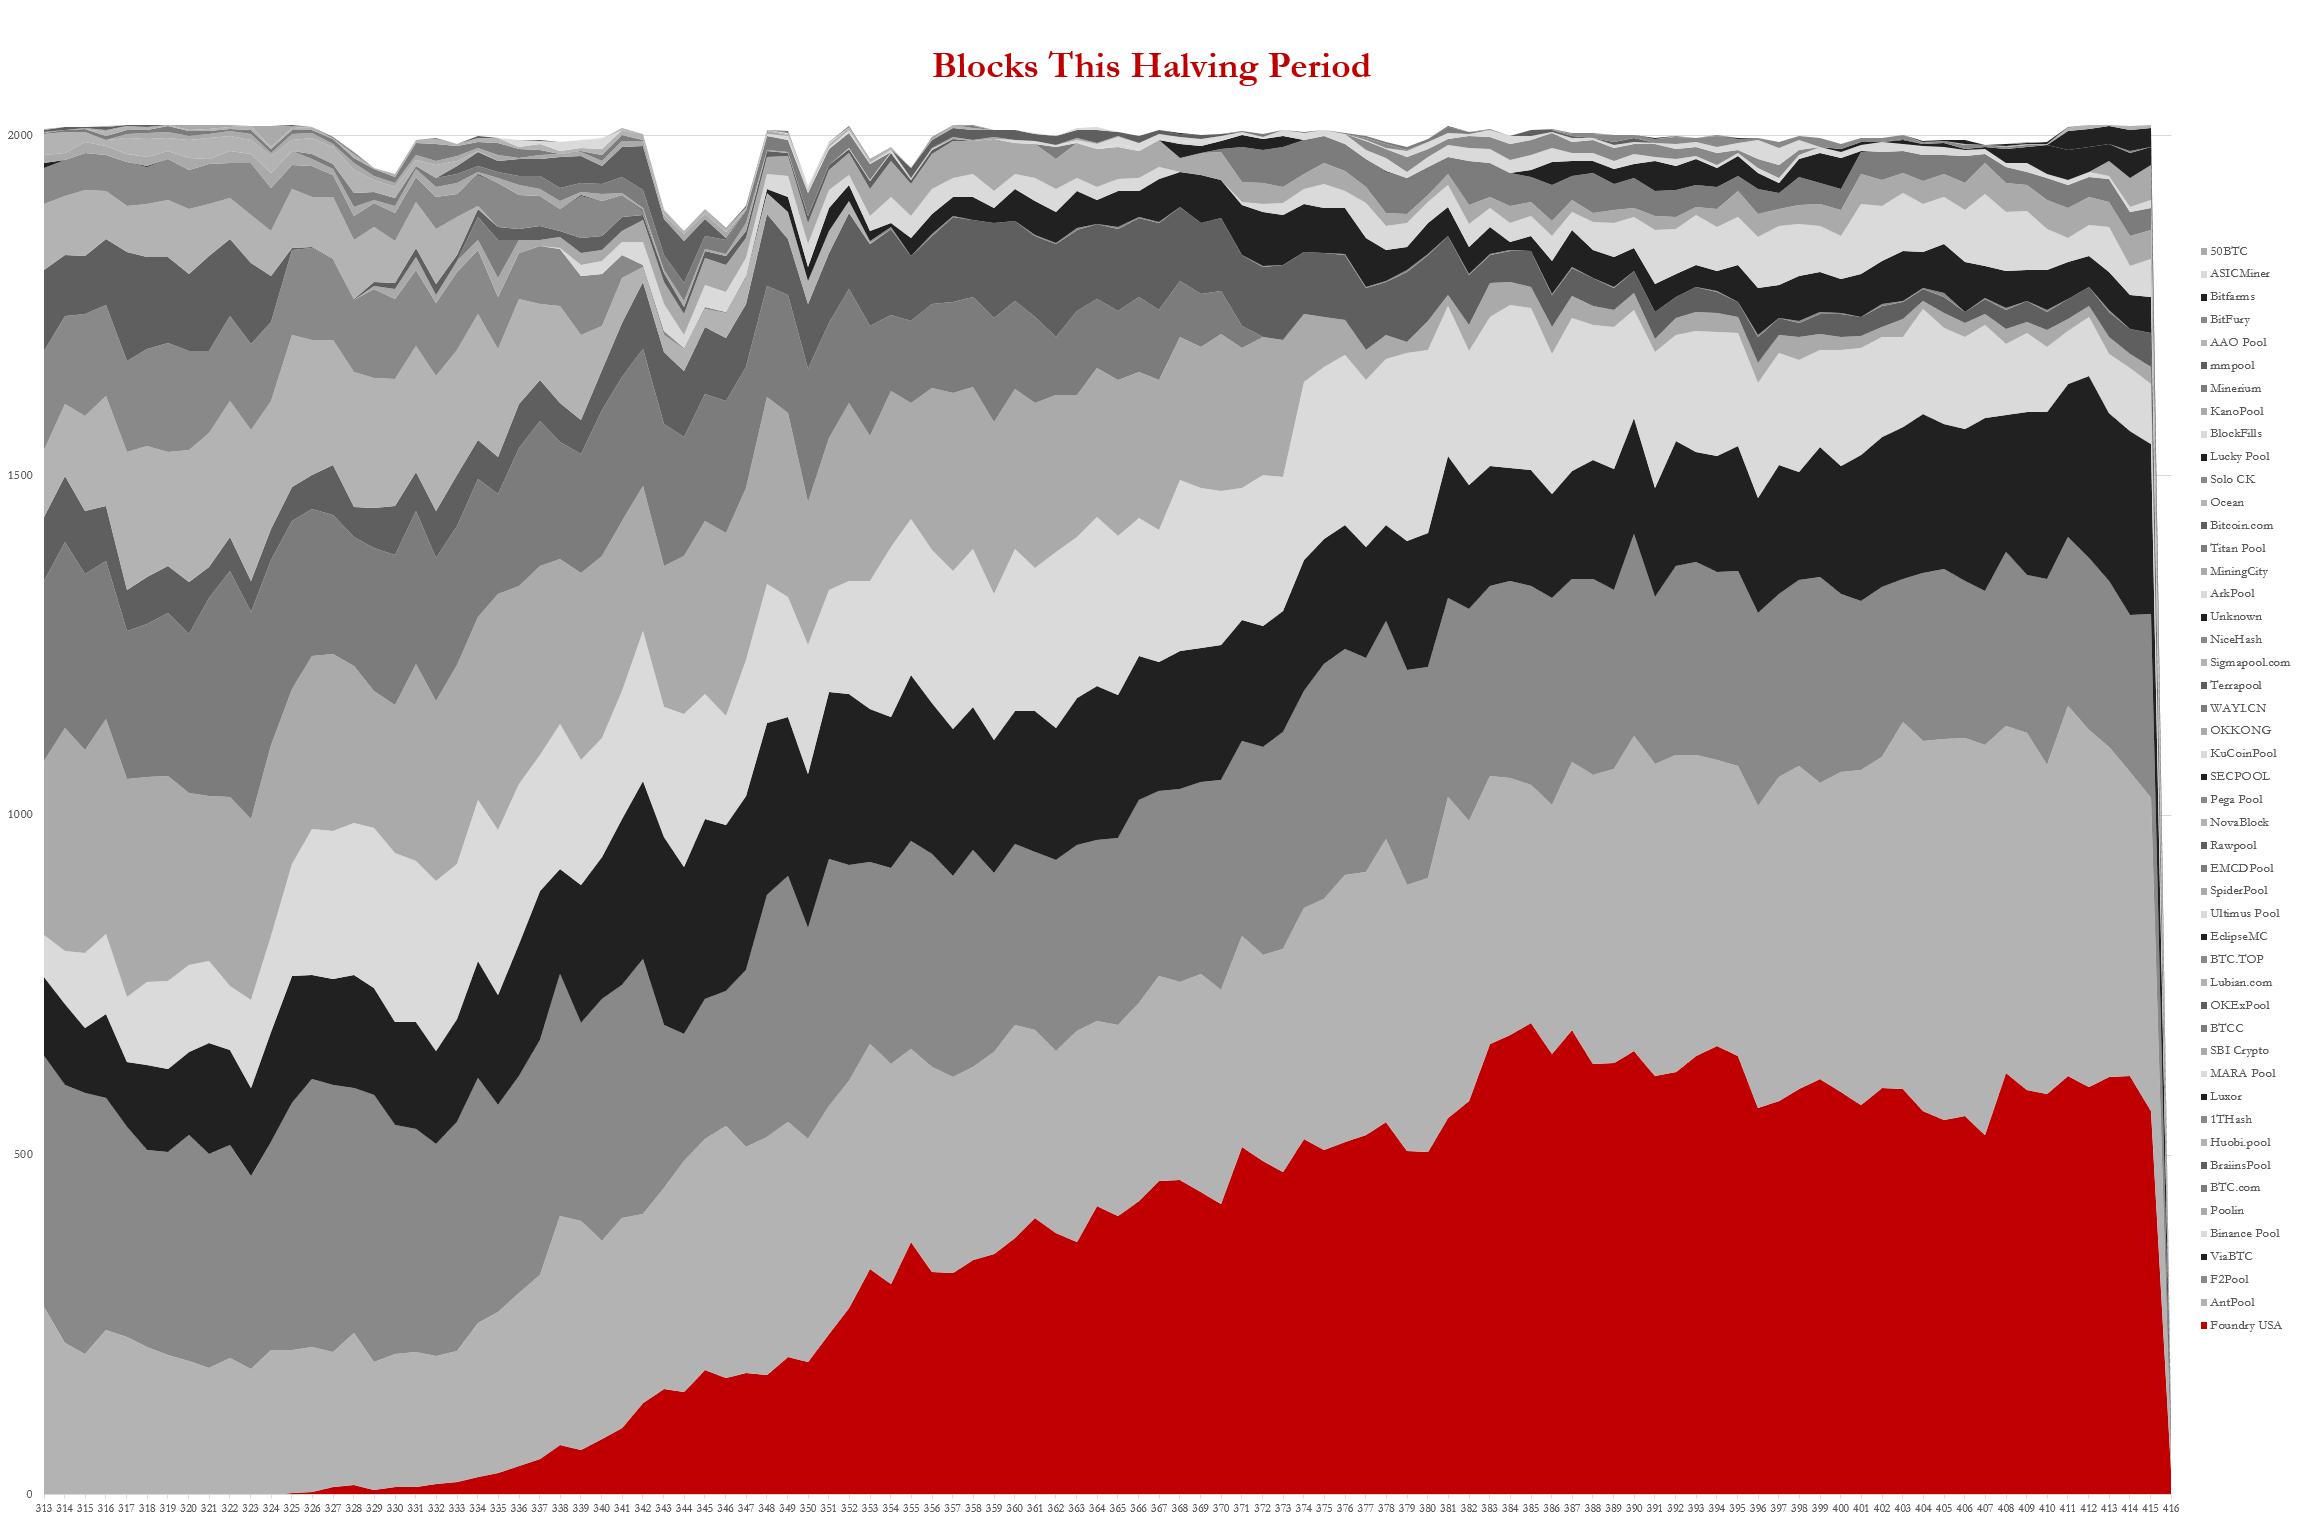
Note the dip in the total area on the chart is due to missing blocks. The X-Axis is difficulty adjustment periods which consists of 2,016 blocks, so the chart should be completely smooth. It ain't perfect but it's honest work. The resulting chart, a Stacked Area Chart of Bitcoin Mined by Pool, visually represents the mining efforts of 48 different pools, ranked by the number of blocks they mined. This visualization reveals compelling narratives:
- The rise and fall of mining pools following China’s mining restrictions.
- The meteoric ascent of Foundry as a major player.
Zooming into the chart, one can observe how several pools lost their prominence during the Chinese mining ban, while new pools emerged, primarily outside China. The standout story of this epoch, however, is Foundry’s rapid rise. In less than four years, they became the largest mining pool in a highly competitive market—a testament to the unforeseen advantages conferred by China’s regulatory changes and Foundry’s strategic negotiations.
During this epoch, Foundry mined 236,580 BTC, including transaction fees. This staggering figure reflects not only their market strategy—which includes stringent KYC requirements making them akin to an NSA-affiliated pool—but also their appeal to publicly traded U.S. miners, likely a significant factor in their explosive growth.
Running The Numbers On The Pools
Here are some interesting data points and observations from the list of Bitcoin mining pools and their performance from this epoch:
- Top Performers:
- Foundry USA leads the field with blocks mined at 36,137 blocks, totaling 236,580.89 BTC, including fees. This makes Foundry USA the top miner in terms of both the number of blocks mined and the total Bitcoin mined.
- AntPool is a close second, with 35,667 blocks mined and 236,100.23 BTC in total, showing a very competitive output closely trailing Foundry USA.
- Significant Total BTC Mined:
- The top five mining pools (Foundry USA, AntPool, F2Pool, ViaBTC, and Binance Pool) together mined a substantial portion of Bitcoin, accounting for approximately 933,648.57 BTC. This represents about 68.5% of the total BTC mined by all listed pools (1,361,946.19 BTC).
- Mid-Tier Pools:
- Pools like Poolin, BTC.com, and BraiinsPool show significant activity but with less than half the BTC mined compared to the leaders. For example, Poolin mined 109,737.87 BTC from 16,513 blocks.
- Emerging and Smaller Pools:
- Smaller or newer pools such as Luxor, MARA Pool, and SBI Crypto also have notable contributions, with tens of thousands of BTC mined, indicating healthy competition and diversification in mining operations.
- Least Active Identified Pools:
- At the lower end of the spectrum, pools like ASICMiner, BitFury, Bitfarms, and 50BTC each mined only one block, contributing less than 10 BTC each. This highlights the significant variance in scale among mining operations.
- Overall Contributions:
- The cumulative mining efforts resulted in over 205,510 blocks mined during the epoch, totaling approximately 1.36 million BTC. This massive output underscores the global and extensive nature of Bitcoin mining.
- Diversity and Competition:
- The list includes 48 different mining pools, reflecting a diverse and competitive landscape in the Bitcoin mining industry. This diversity is essential for decentralization and the overall security of the Bitcoin network.
- Notable Trends:
- The data hints at trends such as the emergence of pools outside China following regulatory changes there, and the significant market positions achieved by pools enforcing strict compliance measures, like KYC.
Blocks and BTC Mined by mining pool
| Miner | Total Blocks Mined | Total BTC Mined (Includes Fees) |
| Foundry USA | 36137 | 236,580.89 |
| AntPool | 35667 | 236,100.23 |
| F2Pool | 30632 | 203,177.06 |
| ViaBTC | 19866 | 131,262.57 |
| Binance Pool | 19186 | 126,527.82 |
| Poolin | 16513 | 109,737.87 |
| BTC.com | 10702 | 71,819.61 |
| BraiinsPool | 7258 | 47,507.71 |
| Huobi.pool | 5170 | 35,658.09 |
| 1THash | 3392 | 23,522.26 |
| Luxor | 3190 | 20,824.79 |
| MARA Pool | 3183 | 21,113.71 |
| SBI Crypto | 2684 | 17,563.11 |
| BTCC | 1845 | 12,112.45 |
| OKExPool | 1710 | 11,637.72 |
| Lubian.com | 1639 | 11,414.55 |
| BTC.TOP | 1431 | 9,939.85 |
| EclipseMC | 564 | 3,711.95 |
| Ultimus Pool | 507 | 3,301.05 |
| SpiderPool | 502 | 3,418.89 |
| EMCDPool | 485 | 3,218.31 |
| Rawpool | 463 | 3,108.88 |
| NovaBlock | 448 | 3,108.74 |
| Pega Pool | 350 | 2,290.42 |
| SECPOOL | 286 | 1,946.85 |
| KuCoinPool | 274 | 1,757.59 |
| OKKONG | 239 | 1,627.49 |
| WAYI.CN | 232 | 1,619.64 |
| Terrapool | 202 | 1,283.44 |
| Sigmapool.com | 175 | 1,184.63 |
| NiceHash | 152 | 1,009.48 |
| Unknown | 143 | 947.25 |
| ArkPool | 61 | 413.57 |
| MiningCity | 53 | 369.21 |
| Titan Pool | 42 | 267.61 |
| Bitcoin.com | 30 | 207.85 |
| Ocean | 27 | 177.75 |
| Solo CK | 25 | 162.24 |
| Lucky Pool | 15 | 112.17 |
| BlockFills | 9 | 56.84 |
| KanoPool | 7 | 48.21 |
| Minerium | 4 | 28.44 |
| mmpool | 4 | 25.39 |
| AAO Pool | 2 | 13.23 |
| BitFury | 1 | 6.87 |
| Bitfarms | 1 | 8.64 |
| ASICMiner | 1 | 6.72 |
| 50BTC | 1 | 6.55 |
| Grand Total | 205510 | 1,361,946.19 |
Let’s bring this home. The data we’ve just dived into doesn’t just map where we’ve been; it lights up the paths we’re heading down. You can see that the bitcoin mining pool landscape can switch with the stroke of a pen, and the next thing you know the NSA is building all the blocks.
As hashrate spreads out globally post-China’s crackdown, the game is just heating up. I don’t want to hear anyone say mining in centralized in the US. I was able to see more than 60% of hashrate is operated by Chinese teams. Sure hashrate migrated here but mining pools are the threat vector. SV2 save us.
As we approach the halving, the introduction of Ordinals might trigger a reorganization of the blockchain. Stratum V2 is still finding its footing, but we’re hopeful. Pools like Ocean are introducing new narratives, and Middle Eastern nations are entering the scene, potentially bringing substantial hashrate advantages due to their zero-cost energy.

Leave a Reply
You must be logged in to post a comment.